

1.Introduction
Over the past three decades, U.S. corporate payouts have followed two strikingly different rhythms. Quarterly dividends paid by S\&P500 constituents have grown smoothly and almost monotonically, barely flinching through the 2000–2001 recession, the global financial crisis, or the COVID-19 shock (Figure 1). Buybacks, by contrast, swing violently with the cycle: they collapsed in each of those episodes and surged whenever cash flows were abundant. The most recent buyback boom coincided with the Federal Reserve's tightening cycle (shaded in blue), reaching a record of roughly $270~billion in early 2022 before pulling back sharply as the funds rate climbed toward 5.25-5.50%
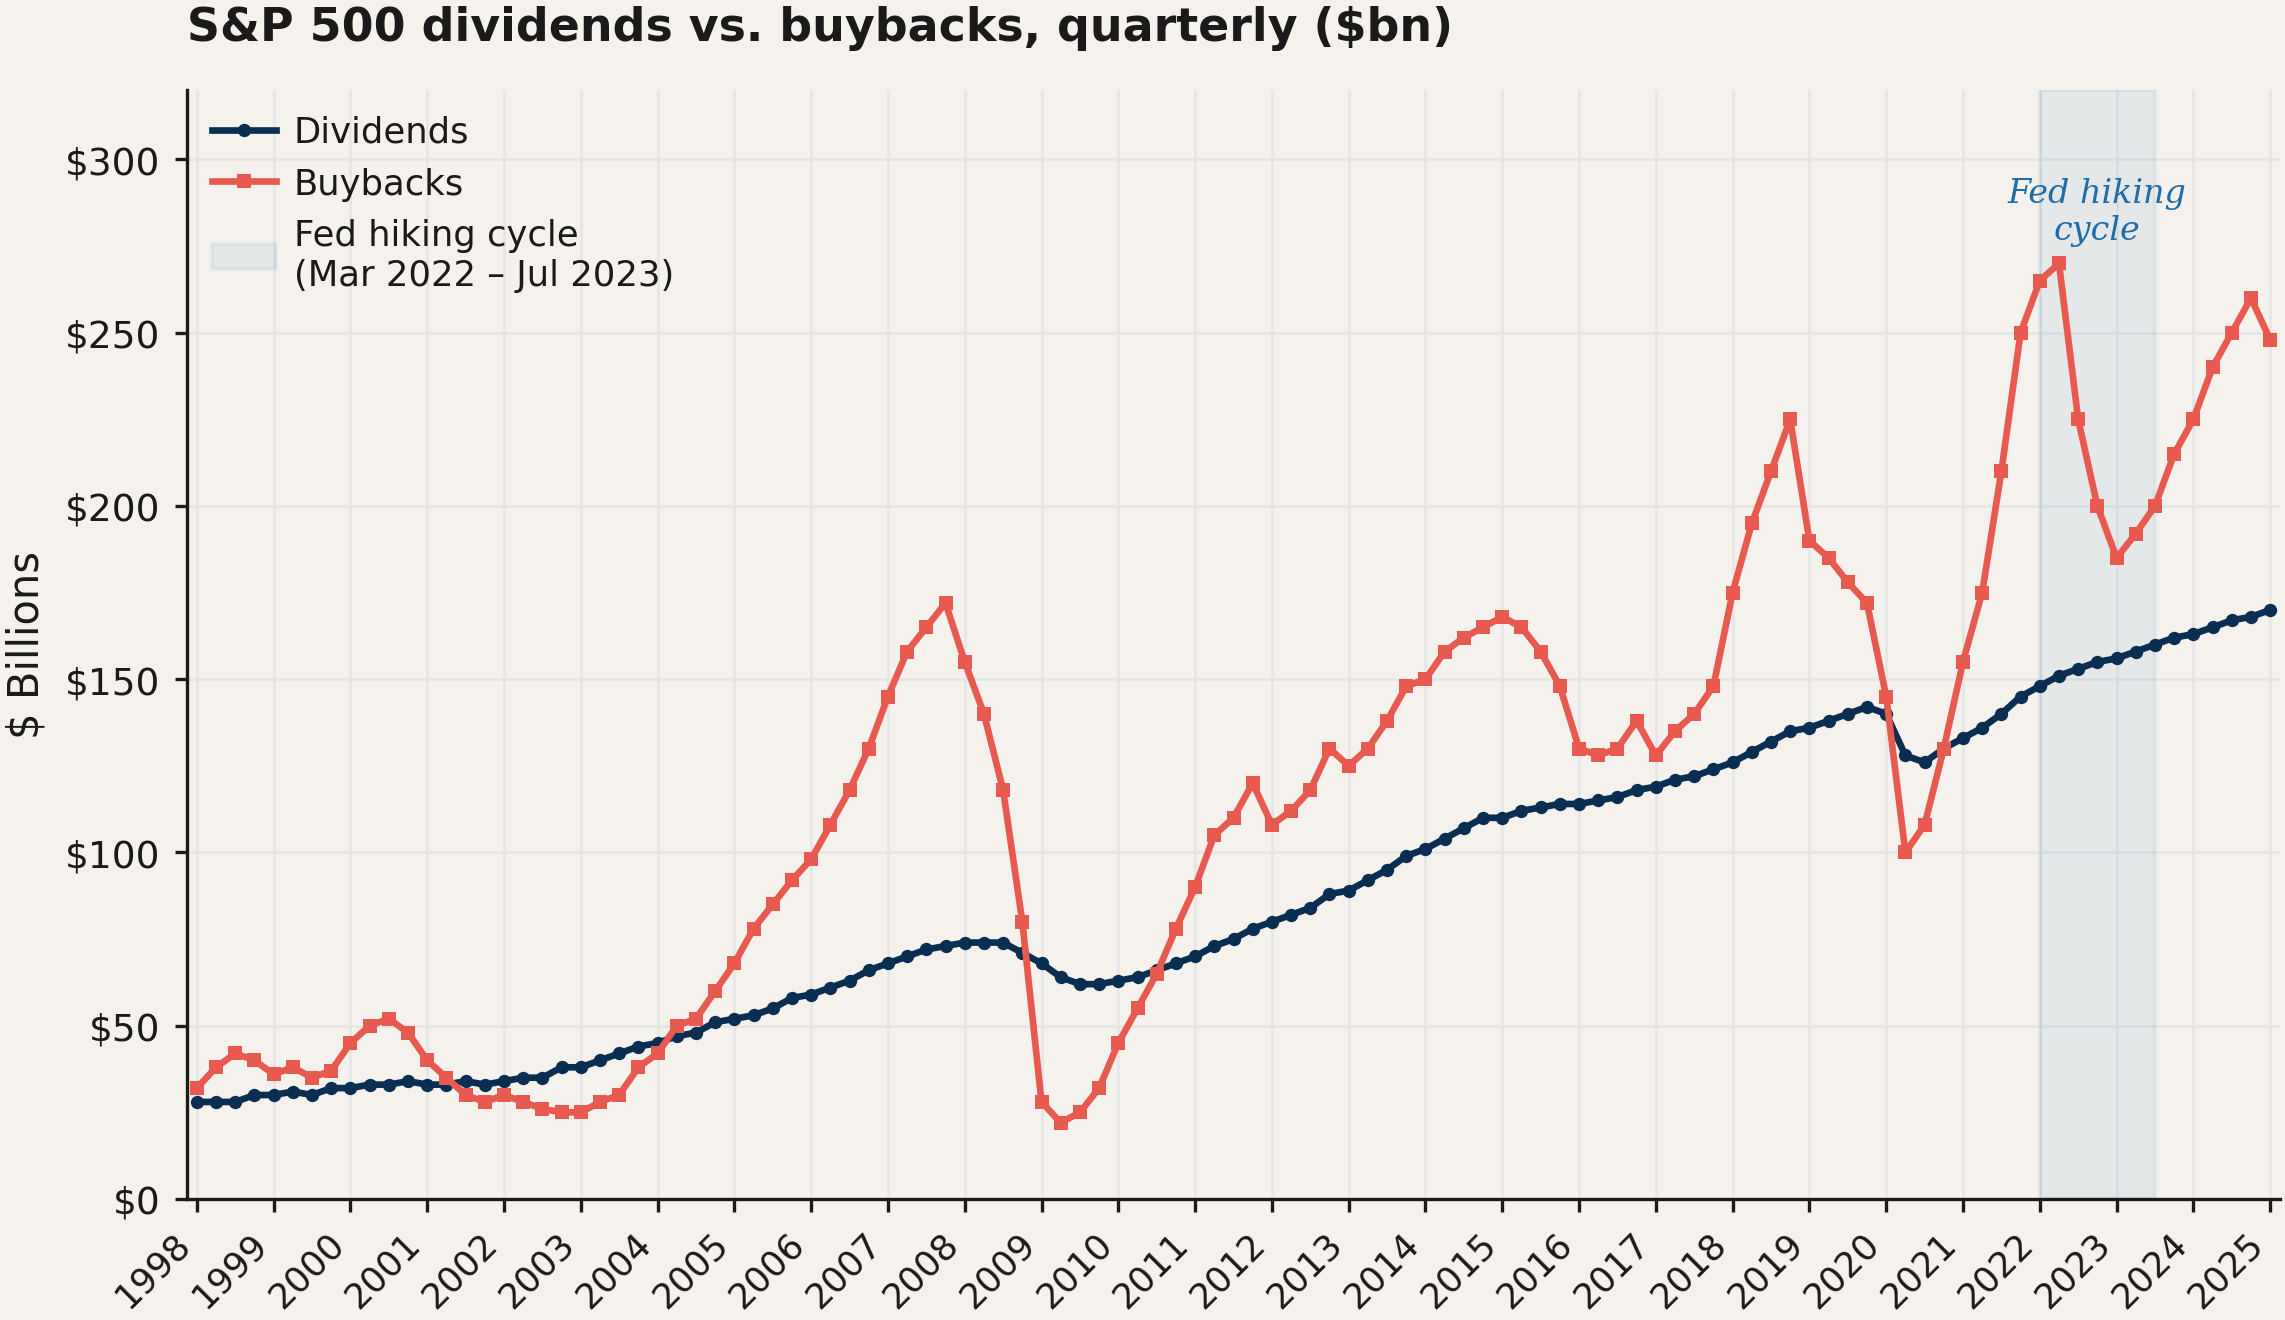
Figure 1: S&P500 quarterly cash dividends and gross share repurchases, 1998--2025 (USD billions).} The shaded band indicates the Federal Reserve's tightening cycle (March~2022 to July~2023). Dividends display a steady, nearly monotonic trend, whereas buybacks are markedly procyclical and contract sharply in recessions. Sources: S&P Dow Jones Indeces.
The intuition behind the buyback retreat is well known: when policy rates rise, debt-financed repurchases become more expensive, interest expense erodes distributable cash, and the flexible component of the payout, namely buybacks, is the natural margin to adjust first. Dividends are sticky by design, since management treats them as a long-run commitment, while repurchases respond to fluctuations in earnings and financing conditions. We do not rederive this logic here, since the conceptual framework, including the dividend-smoothing motive and the signalling content of buybacks, is treated in detail in our companion piece.
The empirical question this paper asks goes one step further. Among the firms that lived through the 2022-2023 hiking cycle, which ones actually cut their buyback share the most? The intuitive answer points to firms whose balance sheets were most exposed to the shock, namely those carrying a large share of short-term debt that needed to be rolled over at higher rates. The alternative is that something coarser dominates: the sector-level cash flow environment, which during this particular cycle was extremely uneven across industries, with energy producers enjoying a windfall while most other sectors faced slowing demand and rising costs.
The answer, on a sample of 48 large U.S. firms across six GICS sectors, is that the sector mattered and balance-sheet exposure did not. Energy was the only sector to raise its buyback share, while the rest of the sample was flat or slightly negative; once sector fixed effects are included, a predetermined measure of rate sensitivity has no predictive power for changes in payout composition. The remainder of the paper develops these results.
2.Empirical Analysis
For this case study we select eight firms from each of six GICS sectors: Technology, Energy, Healthcare, Financials, Consumer Staples, and Industrials, in order to capture the phenomenon across a wide range of business models and make the sample as heterogeneous as possible. This yields a total of 48 firms.
Data and Variables
All financial data are drawn from firm level financial statements (income statement, balance sheet, and cash flow statement) via FactSet, covering the years from 2019 to 2023. We split the sample into two windows: a pre-hike period (2019-2021) and a hiking period (2022-2023), corresponding to the tightening cycle initiated by the Federal Reserve in March 2022.
Our main dependent variable is each firm's Buyback Share, defined as:
We then compute ∆ Buyback Share(i) as the difference between firm i's average Buyback Share in the hiking period and its average in the pre-hike period. A negative value indicates that the firm reduced the weight of repurchases in its payout mix, either by cutting buybacks outright or by raising dividends relative to buybacks.
To measure each firm's exposure to interest rate risk we use its Rate Sensitivity, defined as the ratio of short term debt to total debt at year-end 2021. This captures the share of a firm's outstanding borrowing that would have to be refinanced at higher rates during the hiking cycle: a firm with a high share of short term debt was, ex ante, more exposed to rising rates. Because Rate Sensitivity is measured before the shock, it cannot be a mechanical response to the shock itself, an important property for causal interpretation. In general, this ratio tends to be higher for Tech firms and lower for Energy firms.
Since payout policy is shaped by factors beyond interest rate exposure, we include a standard set of firm level controls. Pre-hike Free Cash Flow (average 2019-2021, USD millions) proxies for firm scale and financial capacity. Revenue Growth between 2021 and 2023 captures the firm's underlying demand environment during the hiking window. Pre-hike Leverage is the average of Net Debt/EBITDA over 2019-2021, and ∆ Interest Coverage is the change in EBITDA/Interest Expense between the hiking and pre-hike periods. The last two variables are conventionally undefined for financial institutions and are therefore missing for the eight Financials in the sample; our empirical strategy addresses this explicitly below.
Table 1: Sector-level averages of key variables. ∆ Buyback Share is the difference between each firm's average buyback share in 2022--2023 and its average in 2019-2021. Rate Sensitivity is the ratio of short term debt to total debt at year-end 2021. Revenue Growth is computed from 2021 to 2023. Source: Stratos Research.
Two features of Table 1are worth noting. First, Energy is the only sector exhibiting a sizeable positive change in buyback share; the full sample mean is close to zero precisely because Energy offsets the modest declines observed elsewhere. Second, Financials display a markedly higher average Rate Sensitivity (0.32), reflecting the large share of short term funding (deposits and wholesale borrowing) on bank balance sheets.
Regression Model
To estimate the effect of rate sensitivity on payout composition, we specify the following cross-sectional linear model:
where X(i) is the vector of firm level controls described above and ∆s(i) are GICS sector fixed effects, which absorb time invariant differences in payout culture across sectors (for example, the structurally higher buyback intensity of Technology firms or the dividend orientation of Consumer Staples).
We then estimate three nested specifications. Model 1 includes only Rate Sensitivity and sector fixed effects. Model 2 adds Pre-hike FCF and Revenue Growth. Model 3 adds Pre-hike Leverage and ∆ Interest Coverage; because these variables are undefined for firms operating in the financial sector (banks), the sample in Model 3 drops to 40 firms.
3.Results
The aggregate pattern in the data
The box plot in Figure 2 shows immediately that the Energy sector was the only one to increase its buyback share relative to the pre-hike period, with roughly a 23% increase, while the rest of the sectors maintained a more neutral position. This is consistent with the widely reported narrative that 2022 was a banner year for the five largest oil and gas majors, which reported a combined $264 billion in profits and announced record shareholder payout programs. ExxonMobil and Chevron alone authorised more than $100 billion in buybacks in aggregate over the hiking window.
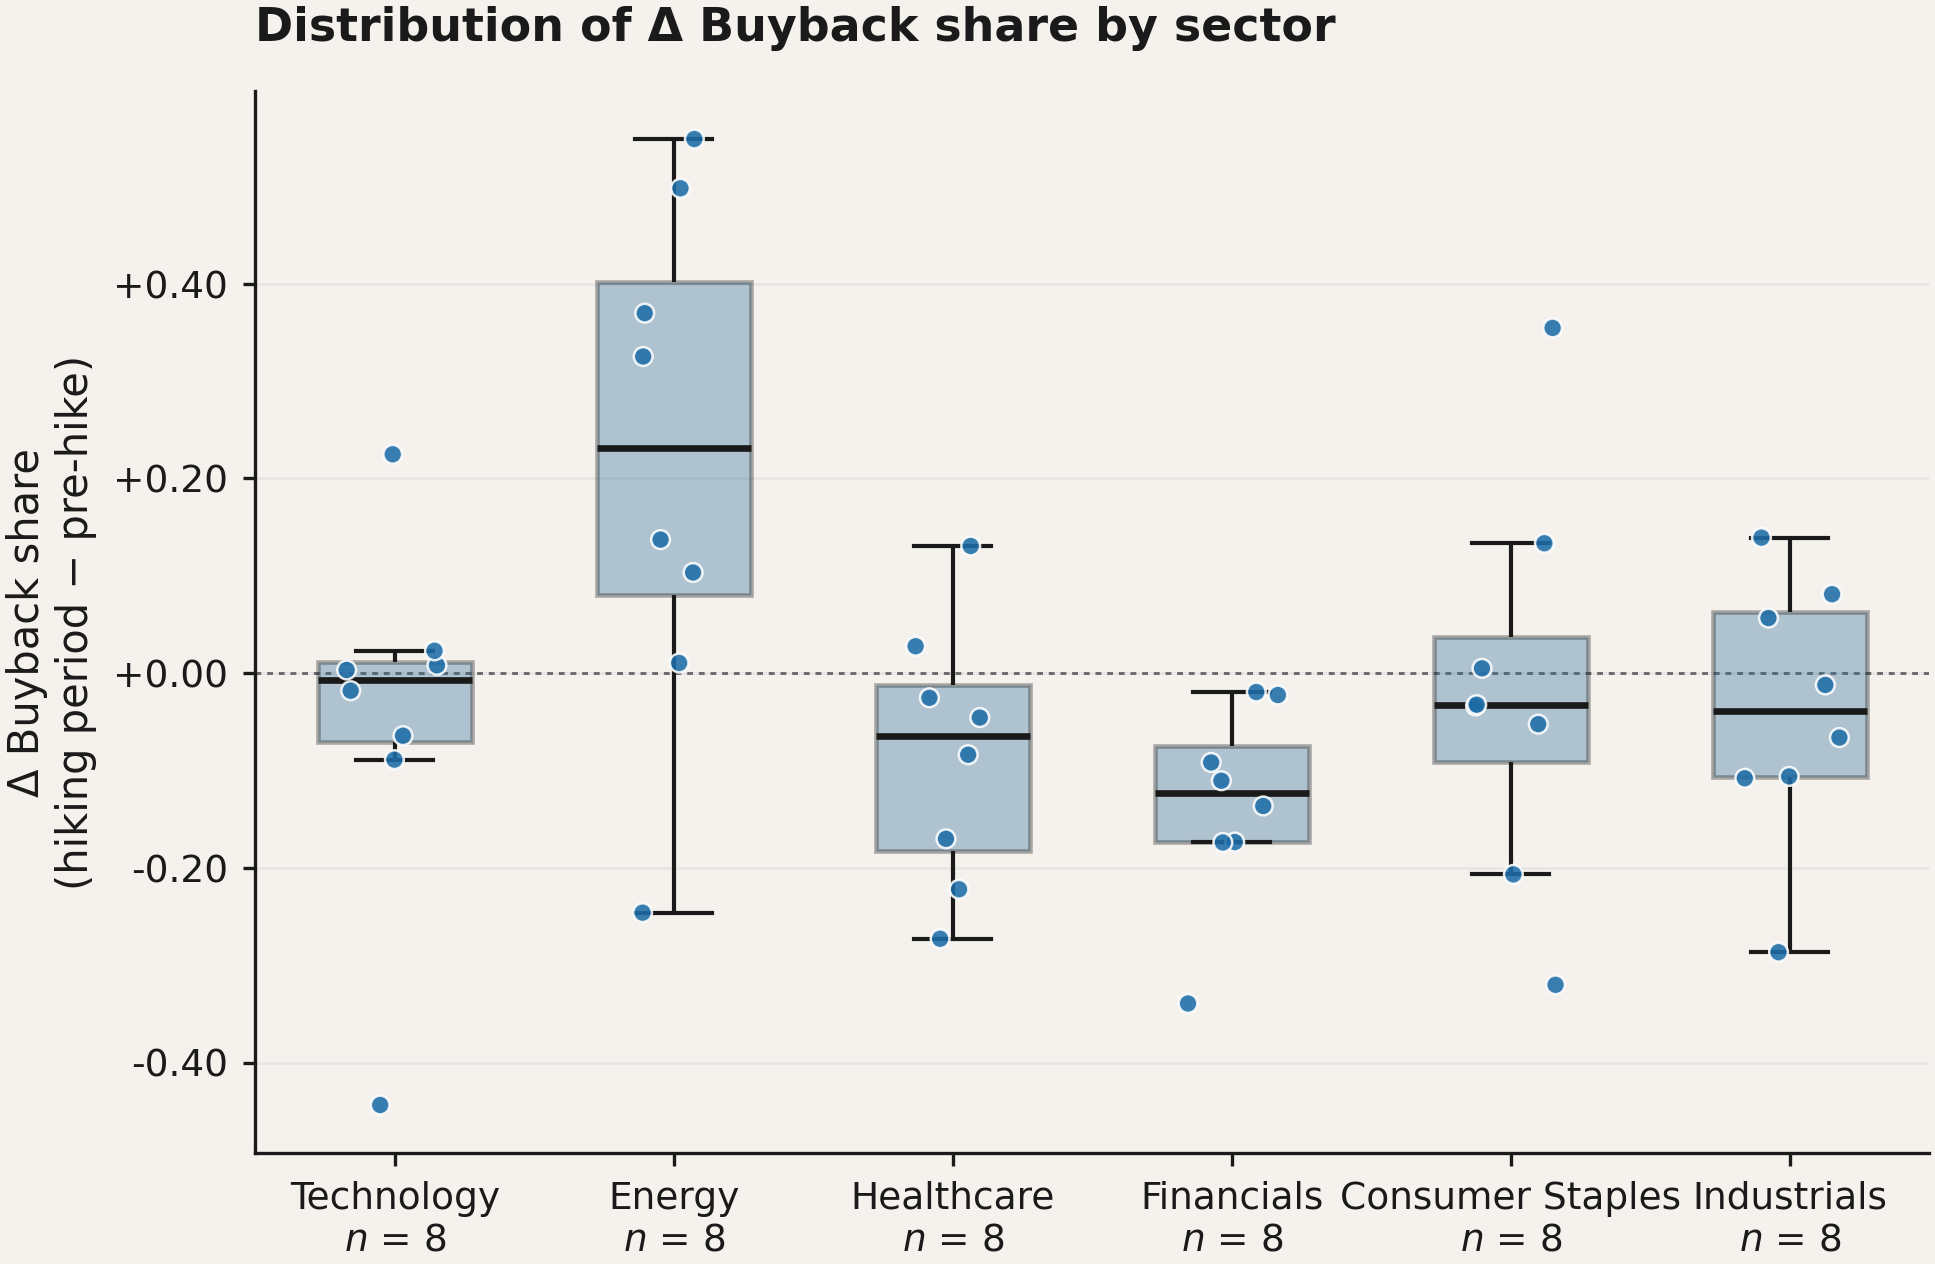
Figure 2: Distribution of ∆ Buyback Share by sector. Boxes show median and interquartile range; points are individual firms. The dotted line marks no change. Energy is the only sector clearly above zero. Source: Stratos Research.
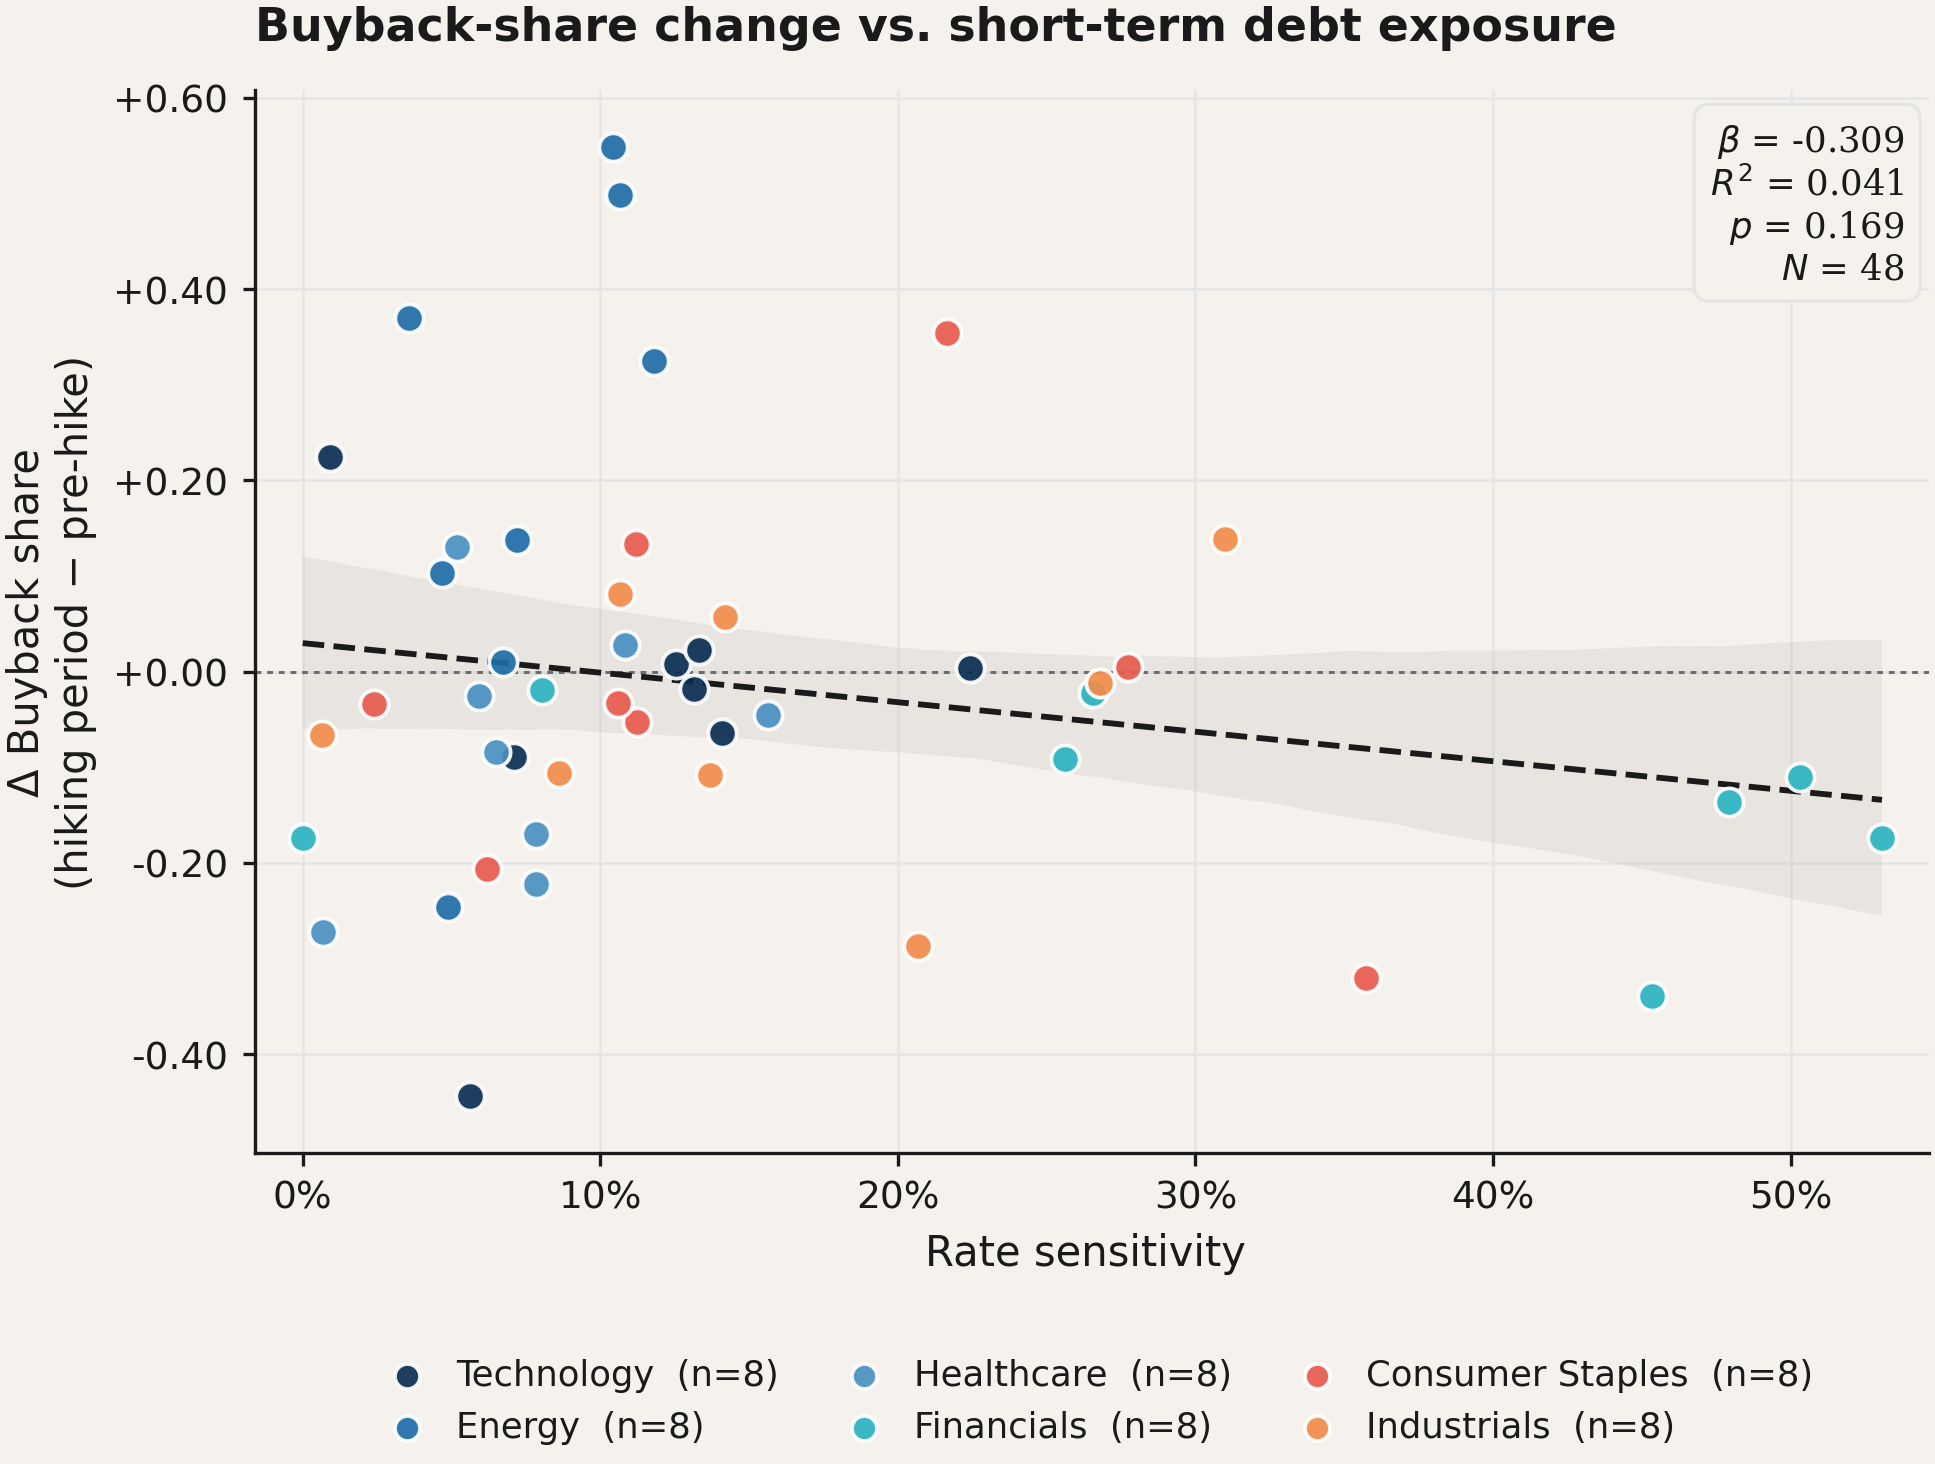 Figure 3 ∆ Buyback Share versus Rate Sensitivity. Each point is a firm, coloured by sector. The dashed line is the pooled OLS fit; the shaded band is the 95% confidence interval. Source: Stratos Research.
This pattern also translates to the firm level relationship between Rate Sensitivity and ∆ Buyback Share. Figure 3 shows a scatter plot with an OLS fit line and a 95% confidence band. Here too it is immediately clear that there was a negative aggregate shift, consistent with the intuition that firms with more short term debt should cut buybacks more; however, the shaded band easily contains a flat line, and the individual dots scatter widely at every level of Rate Sensitivity. The raw bivariate relationship is weak.
Regression results
Table 2 reports the three OLS specifications. The coefficient on Rate Sensitivity is statistically indistinguishable from zero in all three models. In Model 1, which includes only sector fixed effects, the point estimate is (-0.007) with a standard error of (0.234). Adding controls in Model 2 moves the estimate slightly positive (0.046), and the standard error widens substantially. Model 3, which drops Financials in order to include the leverage and coverage controls, produces a larger point estimate (0.231) but with an even wider standard error (0.631). The confidence intervals comfortably span both meaningfully negative and meaningfully positive effects; no specification rejects zero.
Table 2: OLS estimates of ∆ Buyback Share regressed on firm level covariates. All specifications include sector fixed effects. Heteroskedasticity-robust standard errors in parentheses.
Interpretation
Taken together, the aggregate patterns and the regression results give consistent results. The sector of operation was a first order determinant of how firms adjusted their payout mix during the hiking cycle. The Energy sector enjoyed a positive cash flow shock from elevated commodity prices and chose to return much of it via buybacks, while most other sectors shifted slightly in the opposite direction. In contrast, firm level balance sheet exposure to interest rate risk (captured by the share of short term debt over total debt) does not appear to have been an important margin of adjustment.
The reason sector effects dominate so cleanly is that the 2022-2023 shock was not uniform across the economy. Energy benefited from a sharp rise in oil and gas prices that produced a once-in-a-decade cash flow windfall, while most other sectors faced the more conventional combination of slowing demand and rising input costs. When the between-sector variance in cash flow conditions is this large, sector fixed effects absorb most of the cross-sectional dispersion in ∆ Buyback Share, leaving little residual variation for a continuous balance sheet measure to explain. The question of whose buybacks moved is, in this sample, answered almost entirely at the industry level before balance sheet exposure has a chance to enter.
A related caveat is that our Buyback Share treats a dollar of repurchases identically whether it reduces the float or simply offsets stock-based compensation; this distinction is particularly relevant for Technology firms, where a non-trivial share of repurchase activity functions as dilution control.
Several reasons can explain why balance sheet rate sensitivity itself was not a binding constraint for these firms. First, many large firms anticipated rising rates and termed out their debt before the hiking cycle began, locking in low coupons on long maturities and neutralising much of the refinancing risk that the short-term-debt ratio is designed to capture. Second, for firms whose top line cash flows were growing strongly, the marginal increase in interest expense was small relative to the cash available for distribution, so the higher cost of debt simply did not bite hard enough to force a payout adjustment. Third, S&P500 constituents are on average exceptionally well capitalised, with deep access to capital markets and conservative leverage, which gives them more degrees of freedom in the payout decision than the average U.S. firm.
The natural implication is that the balance sheet channel is more likely to be visible in samples populated by smaller or more leveraged firms, or in tightening cycles where the cash flow shock is less concentrated in a single sector.
4. Conclusions
Sector-level cash flow conditions, instead of balance sheet exposure to rates, drove the reshuffling of corporate payouts during the 2022–2023 Fed hiking cycle. Two results emerge. First, the sector in which firms operated mattered: Energy firms increased their share of payouts delivered via buybacks, while every other sector was flat or modestly negative. Second, a pre-determined firm level measure of interest rate exposure did not predict payout changes once sector effects are accounted for. The evidence suggests that sector level cash flow conditions, not balance sheet rate sensitivity, drove the payout responses during this particular tightening cycle.
These findings should be interpreted with some limitations in mind: the sample is small (N = 48) and restricted to S&P500 constituents, so the external validity to smaller or more financially constrained firms is limited. The null result on Rate Sensitivity is not proof that interest rate exposure is irrelevant; it simply shows that, in this sample and for this shock, sector level factors dominated. Extending the analysis to a broader universe of firms, a longer time window, or historical hiking cycles would be a natural next step.
Data Availability. Firm-level financial data, variable definitions, and regression code are available from the authors upon request. All raw data were sourced from FactSet and are subject to standard licensing restrictions.